
Check which measures most in force by country. Does the country have measure (P) affecting exports?.
Use this section to explore visualization of Non-Tariff Measures data derived from UNCTAD TRAINS NTM database.
View Indonesia NTM data visualization based on time-varying data on NTMs, collected and calculated by World Bank staff.
Check which measures most in force by country. Does the country have measure (P) affecting exports?.

Use this visualization to see in which sector is Non-Tariff Measure prevalent
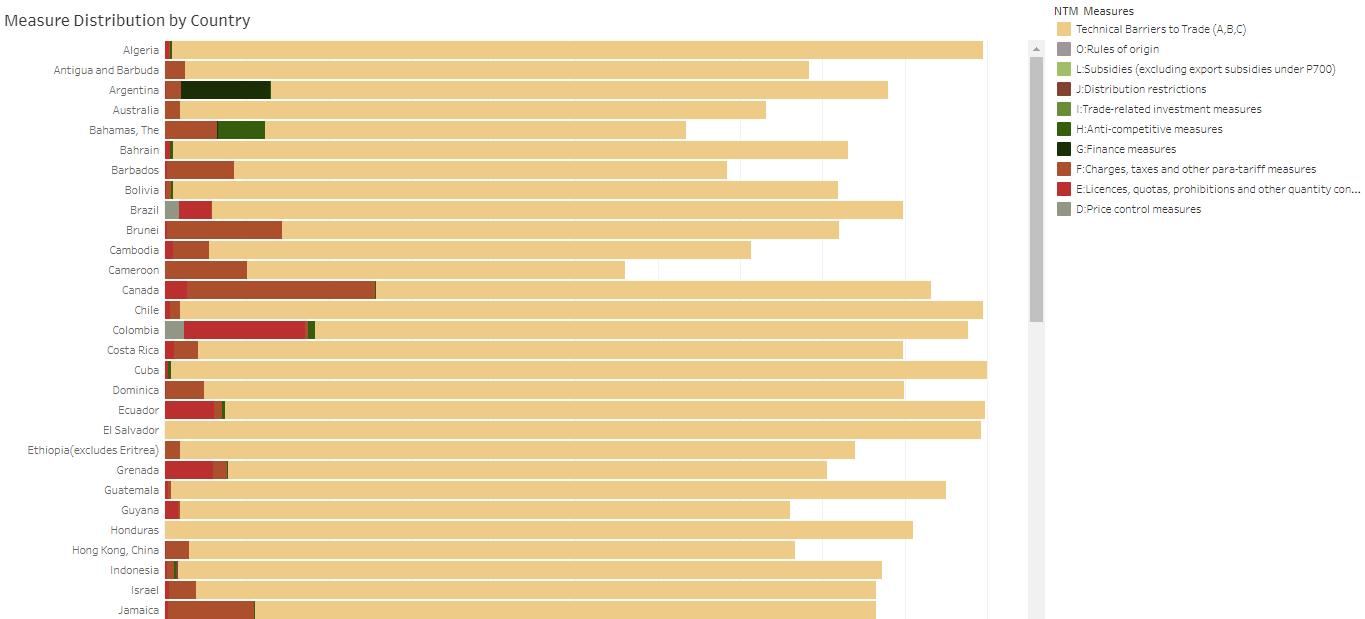
Use this visualization to quickly see if a country has technical measures (ABC) or non-technical measures
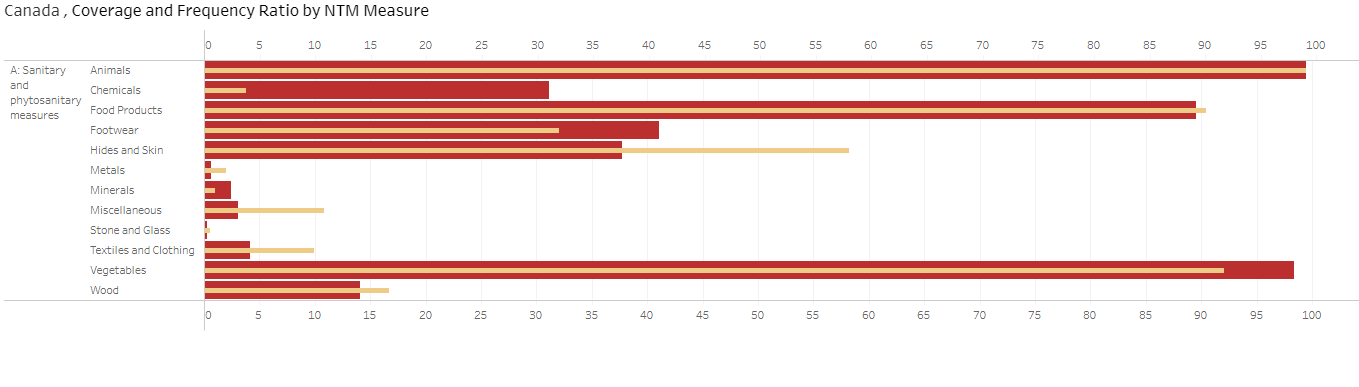
Use this visualization to check a country’s frequency and coverage ratio by sector. If the coverage ratio is greater than the frequency ratio it indicates the impact of NTM is high on that sector.

Use this visualization to quickly glance what measures affect the duty-free imports of a country is affected by one or more NTM.

Use this visualization to obtain effect of NTM’s on duty free imports by sector.