GVC Data Visualization


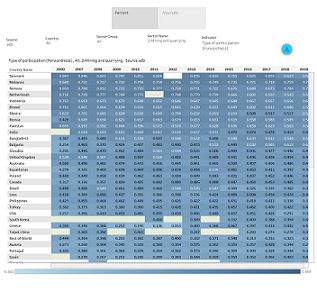
Access GVC Output and GVC Trade visualizations. The visualizations include tabular view, GVC breakdown by GVC Pure Backward, Pure Forward, GVC Mix, Sectoral view of GVC, Split of total output between traditional and GVC trade, maps and more. Click on the icons below to launch the corresponding visualizations.

GVC Output Table

View GVC Output Data in tabular format

View various GVC output indicators in tabular format.

GVC Trade Table

View GVC Trade Data in tabular format

View various GVC trade indicators in tabular format.

GVC Output by mode of participation

GVC Output by mode of participation

GVC output disaggregated by mode of participation (pure backward, pure forward, two-sided).

GVC Trade by mode of participation

View GVC Trade by mode of participation

View GVC trade disaggregated by mode of participation (pure backward, pure forward, two-sided).

GVC Output by Sector

View GVC Output by Sector

View GVC Output distribution by sector.


GVC Trade by Sector

View GVC Trade by Sector

View GVC Trade distribution by sector.


Output breakdown

View Output breakdown

View total output disaggregated by GVC output, output related to traditional trade and purely domestic output.

Gross Trade breakdown

View Gross Trade breakdown

View Gross trade of a country disaggregated by GVC and Traditional trade.

GVC Output Indicators Map

View GVC output indicators in map

View GVC Output Indicators in a map.

GVC Trade Indicators Map

View GVC trade indicators in map

View GVC Trade Indicators in a map.

View Total GVC Output by Country

View Total GVC Output by Country

View Total GVC Output for all country ranked by percent of total.

GVC Trade by Partner

View GVC trade by partner

View GVC Trade by Partner.