Effects on Tariff Revenue, Consumer Surplus and Welfare
SMART also calculates the impact of the trade policy change on tariff revenue, consumer surplus, and welfare.
Tariff revenue change on a given import flow is computed simply as the final ad-valorem tariff multiplied by the final import value minus the initial ad-valorem tariff multiplied by the initial import value.
The graphics below illustrates the link between tariff revenue, consumer surplus and welfare changes. It depicts the market for a given imported good with D and S the demand and supply curves (export supply elasticity is infinite).
Impact of reducing a tariff from t0 to t1
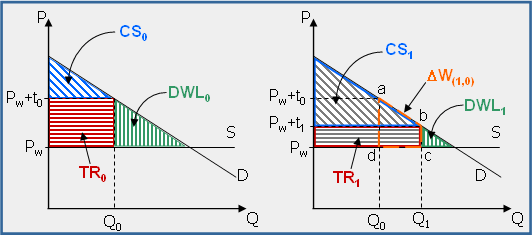
The left hand diagram depicts the current (pre cut) situation where the considered good faces a tariff (t0) which entails a domestic price of Pw+T0 (Pw is world price) and, given the structure of the demand, an imported quantity of Q0. The following variables are captured by the graphics:
- Initial Tariff Revenue (TR0): is represented by the horizontal red stripe rectangle and is equal to Q0*T0.
- Initial Consumer Surplus (CS0): is representedby the diagonal blue stripe triangle and is broadly defined as the difference between the consumer's willingness to pay (marginal value) and the amount she actually pays.
- Initial Dead-Weight Loss (DWL0): is representedby the vertical green stripe triangle and represents what the economy looses in terms of welfare by imposing tariff t0 on the imported good.
The right hand graphics depicts the impact of reducing the tariff from t0 to t1. Since the domestic price (Pw+t1) is lowered compared with the initial state, import demand increases from Q0 to Q1 with consequences on the variables seen above:
- Final Tariff Revenue (TR1): is representedby the horizontal stripe rectangle and is equal to Q1*T1. The result is not straightforward and depends on the magnitude of the import demand elasticity.
- Final Consumer Surplus (CS1): is represented by the diagonal stripe triangle. This result is not calculated by SMART, despite the (improper) use of the term Consumer Surplus in some results provided by SMART.
- Final Dead-Weight Loss (DWL1): is represented by the vertical green stripe triangle and represents what the economy still looses in terms of welfare because of the remaining tariff protection.
- Welfare Change (DW): is represented by the a-b-c-d area and is what the economy as a whole gains by reducing the tariff from t0 to t1 (the reduction in dead-weight loss). This gain is made of:
- The additional tariff revenue entailed by the increase in imports (Q1-Q0)*t1
- The additional consumer surplus entailed by the increase in imports
½*(Q1-Q0)*(t0-t1).
It should be noted that tariff revenue change is made of two opposite effects:
- A tariff revenue loss at constant import value, which corresponds to a transfer from the State to consumers and is equal to Q0*(t0-t1).
- A tariff revenue gain through the increase in imports which enlarges the tax base and is equal to (Q1-Q0)*t1.
Using SMART internal import demand elasticity values, the tariff liberalization simulation returns a negative tariff revenue change (that is revenue gain from increased imports not enough to dominate revenue loss due to tariff decrease) in most cases.
Next: SMART Input Requirements and Output Results
WITS Online Help
The World Bank, 2010